

Software engineering bottlenecks are one of the biggest reasons teams miss delivery targets, accumulate delivery risk, and struggle to turn engineering investment into business outcomes.
Your teams can look busy in Jira, active in GitHub, and productive in stand-ups, yet delivery can still be slow. And as AI increases coding throughput, those constraints often become even more visible.
In the Plandek 2026 Benchmarks Report, we found that lower-performing teams deliver software nearly 3x slower (62 days vs 22.5 days) despite similar levels of engineering activity.
The problem is not effort. It is how work flows through the system, and how that flow impacts four critical outcomes: focus, speed, predictability, and quality.
For senior engineering leaders, our challenge is not just identifying where bottlenecks exist, but understanding how they are degrading these outcomes – and fixing them without relying on guesswork.
In this guide:
What are software engineering bottlenecks?
What causes software engineering bottlenecks?
How to identify software development bottlenecks?
Which software engineering productivity metrics matter?
How to fix bottlenecks and improve overall software delivery?
What Are Software Engineering Bottlenecks?
A software engineering bottleneck is where work waits long enough to reduce end-to-end software delivery performance.
Bottlenecks can exist anywhere in your lifecycle, including in requirements and planning, development, code review, testing, QA and release and deployment.
You will likely be familiar with those telltale signs of bottlenecks at various stages within your SDLC.
Pull requests waiting days for review
Work piling up in QA or testing
Long gaps between “code complete” and “released”
High work in progress (WIP) with low completion rates
Cycle time increasing despite higher activity
Frequent context switching and blocked work
The Hidden Cost of Engineering Bottlenecks
Bottlenecks directly impact delivery performance, predictability, and engineering ROI.
In Plandek’s 2026 benchmarks, we found that lower-performing teams delivered software nearly 3x slower, completed less than half of planned work, and spent ~80% of engineering effort on non-roadmap activity.
They rarely appear as isolated failures. Instead, they create persistent friction across the delivery system.
As organizations adopt AI-assisted development, this becomes more acute. There is already a high degree of impact of AI on software delivery. AI increases throughput at the coding stage, but unless downstream capacity scales with it, bottlenecks intensify.
Work moves faster into the system, but not out of it.
When bottlenecks persist – particularly in AI-enabled environments– organizations typically see:
Longer cycle times: faster coding increases input, but downstream constraints (review, QA, release) extend overall delivery time
Lower delivery predictability: increased volume creates more variability in how long work takes to complete
Rising work in progress: more work is started as AI accelerates development, but completion rates do not keep pace
Increased context switching: engineers move between tasks while waiting on reviews, testing, or dependencies
Pressure on quality: higher throughput into constrained stages leads to rushed validation and increased defect risk
Slower feedback loops: bottlenecks delay validation, meaning teams learn later despite moving faster upstream
Reduced business impact from AI investments: engineering output increases, but delivered value does not scale accordingly
Without system-level visibility, this leads to a common mistake: assuming productivity has improved when the constraint has simply moved.
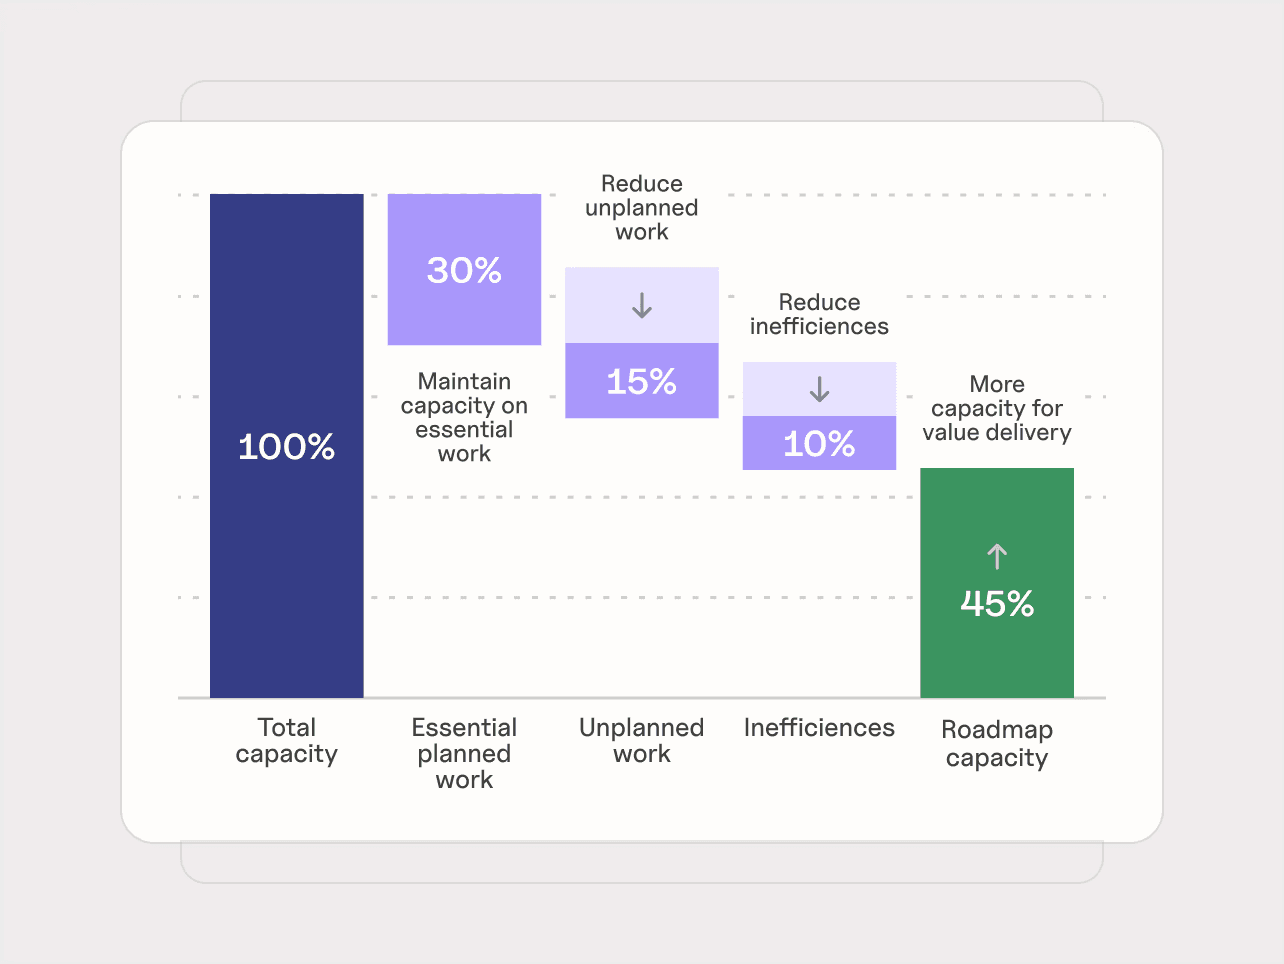
Bottlenecks ultimately determine how much engineering effort becomes delivered value. As AI adoption increases, we place more emphasis on managing those constraints, so that we can reduce unplanned work and inefficiencies, leaving more resources for delivering value.
Why Software Engineering Bottlenecks Are Hard to See
Bottlenecks are harder to detect today because delivery is fragmented across tools, teams, and increasingly accelerated by AI.
1. Teams operate with a local view
Most teams optimize for their part of the process:
developers focus on coding throughput
QA focuses on test execution
platform teams focus on infrastructure
leadership relies on workflow states in tools like Jira
This creates blind spots. A team can appear efficient locally while contributing to a system-wide slowdown.
Bottlenecks are not local problems – they are system constraints.
2. Activity is mistaken for progress
Leaders often assess activity rather than flow. Common false signals include:
High developer activity: many commits and pull requests, but slow delivery
Healthy sprint progress: planned work looks on track while cycle times worsen
Busy teams: high utilisation with no improvement in throughput
Strong coding velocity: faster development shifts the constraint downstream
The key question is not where people are working hardest – it is where work is waiting.
3. Delivery data is fragmented across tools
Modern delivery spans multiple systems:
Jira (planning)
Git (code activity)
pull requests (review)
CI/CD pipelines (build, test, deploy)
Each provides a partial view. None captures end-to-end flow. PM tools like Jira primarily reflect intended workflow rather than actual execution across the delivery system. They do not reliably show:
waiting time between stages
pull request delays
time from merge to deployment
blocked or idle states
Many bottlenecks exist in the gaps between these systems.
4. AI is accelerating the problem
AI can be applied across the entire software delivery lifecycle. In practice, most teams start with code generation. That increases output at the coding stage without changing the rest of the system.
The result is predictable: more work enters the system, but downstream stages cannot absorb it at the same rate.
Pressure shifts into:
pull request review
integration
testing
release and deployment
We see the same pattern repeatedly: more code is produced, more pull requests are opened, teams look busier, yet delivery performance does not improve. In many cases, it degrades.
AI does not remove bottlenecks. Applied unevenly, it amplifies them.
What Causes Software Engineering Bottlenecks?
Bottlenecks are rarely random. They emerge from predictable constraints within the delivery system.
A useful way to understand them is not just by where they appear, but by how they reduce performance across four key dimensions: focus, speed, predictability, and quality.
Focus bottlenecks: too much capacity is spent away from value delivery
Top-performing teams spend more than 41% of their capacity on value delivery, compared to less than 21% for the lowest-performing teams. [Plandek 2026 Engineering Benchmarks Report]
Focus suffers when engineering time is repeatedly diverted into work that does not move roadmap outcomes forward. Common causes include:
Lack of clear requirements: unclear or unstable requirements create rework, repeated clarification, delayed starts, and misaligned execution
Too many parallel priorities: excessive work in progress weakens flow, reduces completion rates, and increases context switching
Dependency management issues: teams cannot move independently because shared systems, teams, or decision points repeatedly block progress
Support and maintenance overload: bugs, incidents, escalations, and reactive work consume capacity that could otherwise be used for roadmap delivery
The result is that teams stay busy, but too little of their effort turns into new value.
Speed bottlenecks: work cannot move efficiently through the system
Speed bottlenecks appear when one stage cannot absorb incoming work fast enough, causing waiting time, batching, and queue build-up.
Top-performing teams deliver an increment of software in under 22.5 days, while lower-performing teams take over 62 days. [Plandek 2026 Engineering Benchmarks Report]
Common causes include:
Inefficient code reviews: review capacity does not scale with coding throughput, especially in AI-enabled teams, so pull requests sit waiting or go through repeated review cycles
Delayed testing and QA: validation happens too late or in batches, creating queues between code complete and release
Over-complex release or approval paths: governance, sign-offs, or rigid release processes delay work that is already implemented
Shared platform or DevOps constraints: multiple teams depend on the same function, environment, or infrastructure capacity, creating recurring slowdowns
These issues slow end-to-end delivery even when developers are coding quickly.
Predictability bottlenecks: the system is too unstable to deliver consistently
Predictability suffers when work is constantly disrupted by changing scope, unclear ownership, or coordination delays.
Lower-performing teams typically complete less than 48% of planned sprint work, compared to over 68% for top-performing teams, driven in part by much higher levels of mid sprint scope change. [Plandek 2026 Engineering Benchmarks Report]
Common causes include:
Slow handoffs between functions: work moves between development, QA, security, and operations with too much waiting time or ambiguity
Poor collaboration between teams: cross-team dependencies introduce repeated coordination overhead and unresolved blockers
Unclear ownership: decisions stall when no one is clearly accountable for moving work forward
Frequent scope change: changing priorities during execution disrupt plans, increase carry-over, and make delivery timelines less reliable
These are the issues that make sprint outcomes inconsistent and delivery commitments harder to trust.
Quality bottlenecks: the system creates more defects, rework, and technical friction
Quality bottlenecks emerge when teams cannot validate changes early and consistently enough to maintain healthy delivery flow.
Lower-performing teams introduce roughly one bug for every 0.8 stories delivered, while top-performing teams deliver more than 2.5 stories per bug, allowing them to maintain flow without growing defect backlogs. [Plandek 2026 Engineering Benchmarks Report]
Common causes include:
Weak feedback loops: delayed quality signals mean issues are discovered later, when they are harder and more expensive to fix
Under-resourced testing: limited QA capacity or test automation creates a hard ceiling on throughput and increases defect risk
Specialist dependency on a small number of people: quality decisions, approvals, or technical validation depend on too few individuals
Rushed downstream stages: when review, testing, or release is overloaded, teams are more likely to pass defects forward or accumulate bug debt
This creates a compounding effect: poor quality reduces future focus, slows speed, and weakens predictability.
How to Diagnose and Fix Software Engineering Bottlenecks
1. Map the real software delivery flow
Start by defining how work actually moves from idea to production.
In most organizations, this includes:
planning
development
code review
testing
release
production
This should reflect system-level real execution across tools, not just workflow states in a PM tool. We often see teams and leaders rely on project management workflows as a proxy for delivery. In practice, these often mask the true path work takes across Git, pull requests, and CI/CD systems.
2. Find where work waits
Software engineering bottlenecks show up as waiting time and queue build-up.
Focus on where work slows between stages:
pull requests waiting for review
work queued for testing
items blocked by dependencies
completed work waiting for release
These delays are often more significant than active development time. We’re seeing this become even more pronounced with increased AI use. Higher volumes of PRs and faster coding cycles often lead to larger queues downstream, particularly in review and validation stages.
3. Validate the constraint with system-level signals
Local observations are often incomplete. Teams may attribute delays to their immediate environment. You hear this as:
“QA is slowing us down”
“code review is the bottleneck”
“requirements are the issue”
These perspectives are useful, but partial. To identify the actual constraint, you need visibility across the delivery system:
planning data (e.g. Jira, ClickUp, Asana)
code activity (Git)
pull request workflows
CI/CD pipelines
This allows you to distinguish between:
perceived bottlenecks
actual system constraints
It also surfaces delays that sit between tools, where many bottlenecks are hidden. This is where system-level visibility becomes critical. Without it, teams optimize locally and misdiagnose the constraint.
4. Diagnose the root cause, and which pillar is under pressure
Once the constraint is visible, identify why it exists, and how it is impacting performance. Do not stop at the symptom.
For example:
slow code review → oversized PRs or limited reviewer capacity
QA delays → batching or unstable pipelines
release delays → upstream quality or approval bottlenecks
Classify the root cause:
flow design issues (batching, late validation, dependency chains)
collaboration issues (handoffs, ownership, coordination)
capacity issues (overloaded roles, insufficient resourcing)
Then assess impact across:
Focus: is capacity being lost to rework, support, or coordination?
Speed: is work slowing between stages?
Predictability: is delivery becoming less reliable?
Quality: are defects or rework increasing?
This step connects the constraint to measurable outcomes.
5. Measure impact and monitor the next constraint
Has the change improved delivery at the system level?
We might be looking for:
Speed → cycle time, queues
Predictability → consistency of delivery
Quality → defect rates
Focus → % of roadmap work
Remember, it’s crucial to differentiate between:
local improvements (e.g. faster reviews)
system improvements (e.g. faster delivery to production)
If overall delivery does not improve, the bottleneck has likely shifted rather than been resolved, and AI-enabled teams especially will frequently find that constraints are moved downstream. The role of engineering leadership is to maintain visibility across the system and ensure the current constraint is understood and actively managed. Tools to identify bottlenecks can help you find and fix bottlenecks continuously – more on this later.
Which Software Engineering Metrics Actually Matter?
One of the hardest parts of fixing bottlenecks is knowing what to measure.
Most organizations don’t lack data – they lack a clear way to interpret it. Teams track activity (commits, tickets, velocity), but these don’t explain why delivery slows down or where capacity is being lost. Teams may even use DORA metrics or Flow metrics, for example. This is a great way to start – but these frameworks miss key signals, especially as teams transition to AI.
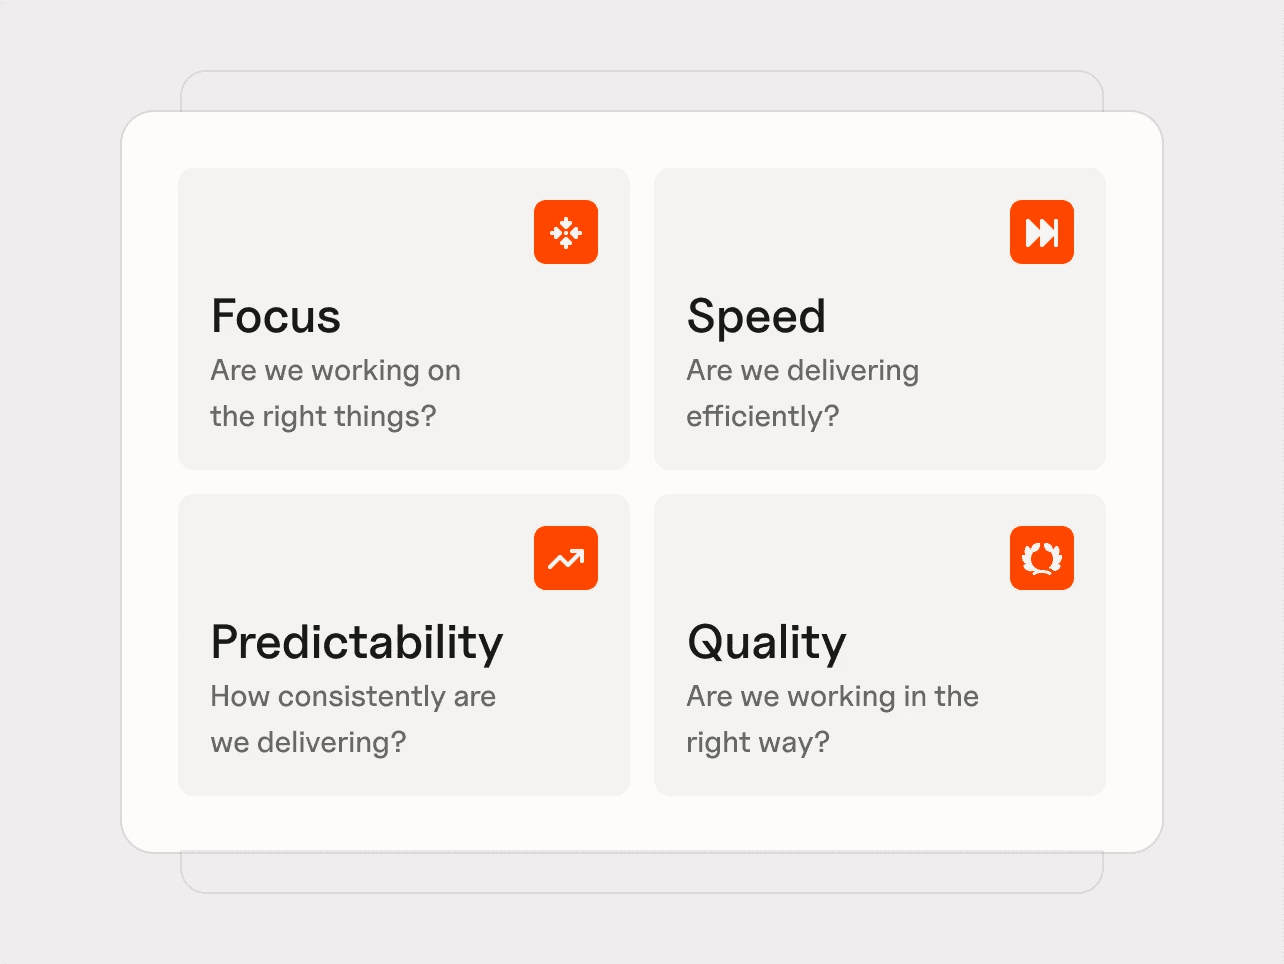
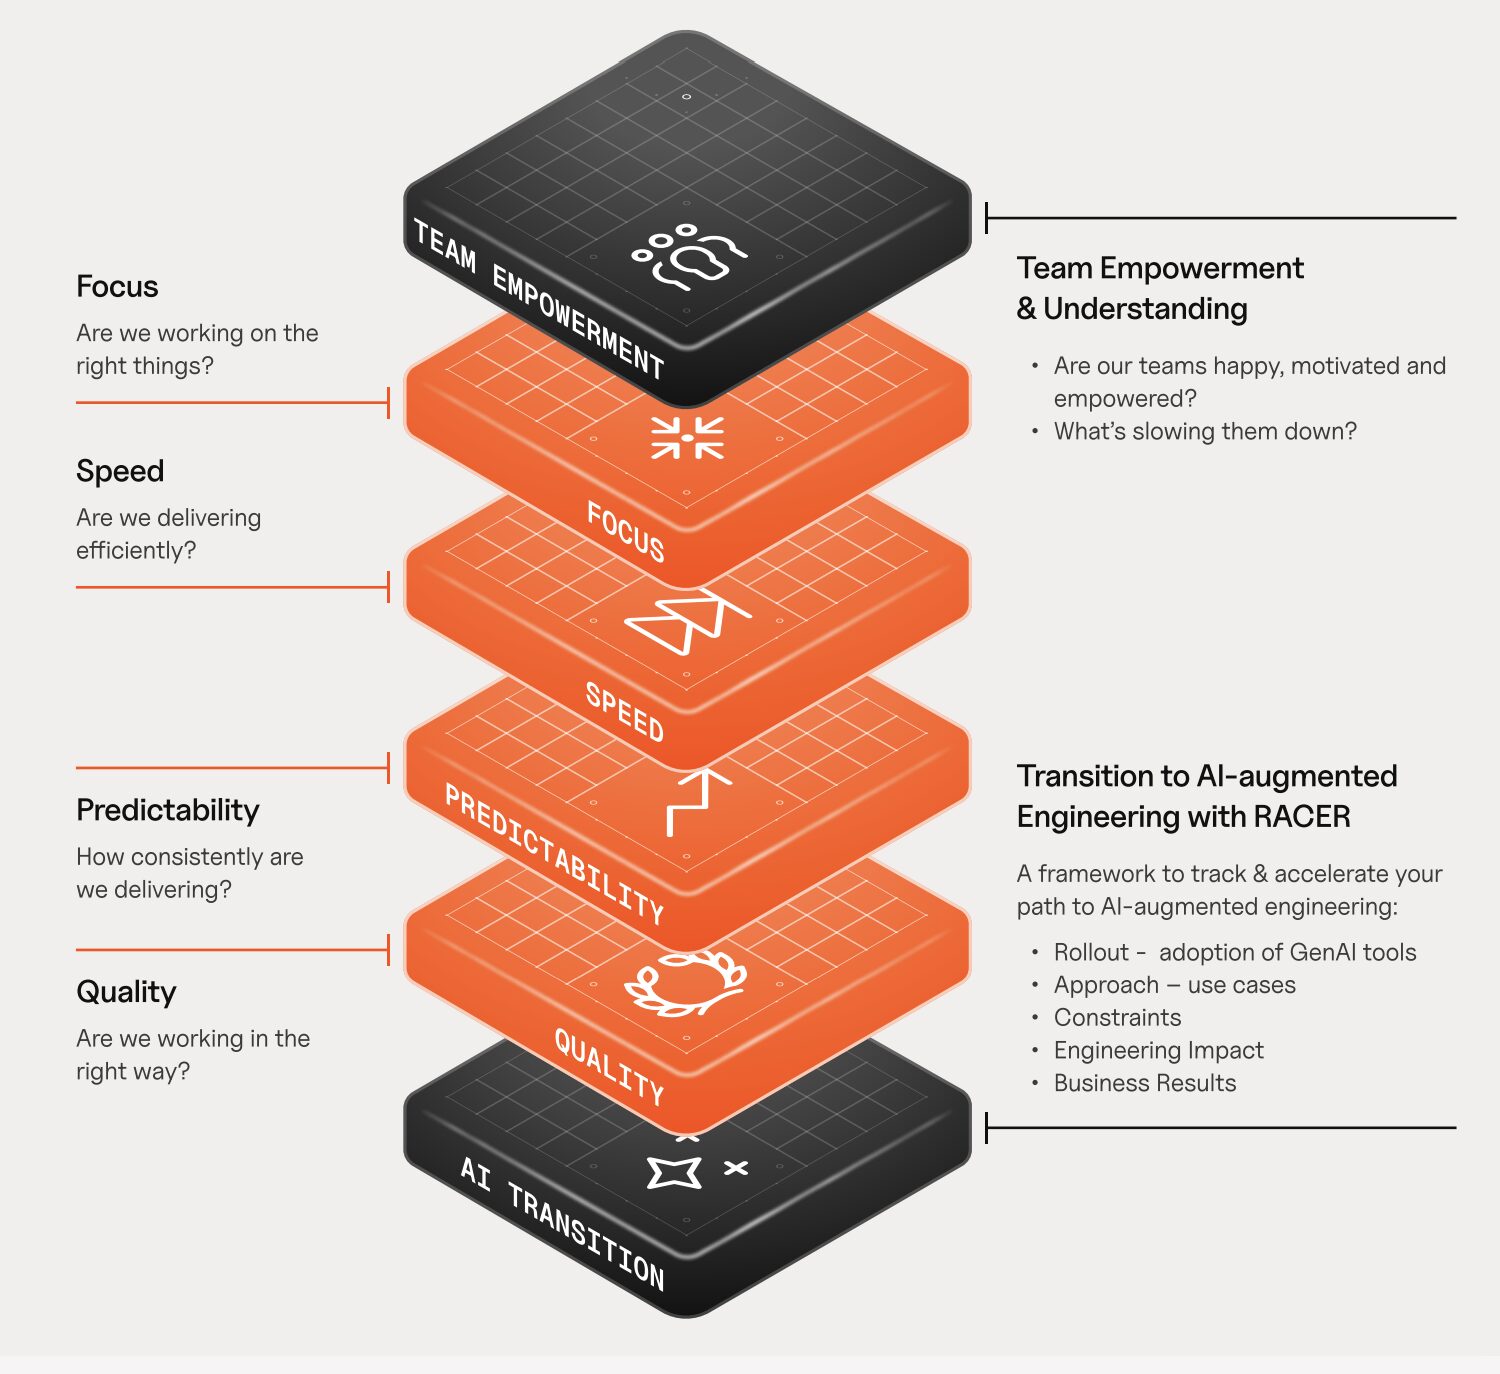
At Plandek, we group engineering performance into these four core dimensions that we’ve been using to group impact: focus, speed, predictability, and quality.
This is The Four Pillars of Productivity Framework
Bottlenecks show up as degradation in one or more of these areas.
Pillar 1 – Focus: are we working on the right things?
Focus measures how much engineering capacity is spent on delivering value versus non-roadmap work.
Metrics:
Value Delivery % — proportion of work aligned to roadmap delivery
Support and Maintenance % — proportion of work spent on bugs, incidents, and other non-roadmap activity
Pillar 2 – Speed: how efficiently does work move through the system?
Speed measures how quickly work flows from idea to production, and how efficiently teams collaborate to deliver it.
Metrics:
Lead Time to Value — time from idea to production
Cycle Time — time from work starting to production
Time to Merge PRs — time from pull request creation to merge
Throughput Quotient — delivery throughput normalized by team size and cycle time
PR Efficiency Quotient — efficiency of turning PRs into merged output
Merge Frequency per author (per week) — how often engineers integrate code
Pillar 3 – Predictability: how consistently can we deliver?
Predictability measures how reliably teams deliver against plan and how stable their execution is.
Metrics:
Sprint Capacity Accuracy — actual work completed vs planned capacity
Sprint Target Completion — percentage of planned work delivered
Mid-Sprint Scope Change % — degree of change to planned work during a sprint
Velocity Volatility — variation in delivery output over time
Pillar 4 – Quality: are we creating sustainable delivery?
Quality measures whether teams can deliver without generating rework, defects, and long-term delivery friction.
Metrics:
Bug Resolution Time — time taken to resolve defects
Stories Delivered : Bugs Raised ratio — relationship between output and defects created
These four pillars reflect the measurable differences between high- and low-performing teams observed across more than 2,000 engineering teams in Plandek’s benchmarks.
Struggling With Bottlenecks? Plandek Helps You See and Fix Them
As an engineering leader, you’re not short on data – you’re short on clarity across the system.
Plandek gives you a single, end-to-end view of how work actually flows across your SDLC, so you can stop guessing where the constraint is, and start addressing it directly.
This allows you to:
see where capacity is being lost (focus)
identify where work is actually waiting (speed)
understand why delivery is inconsistent (predictability)
track whether quality is improving or degrading (quality)
Instead of relying on team-level signals or assumptions, you can identify the constraint that is actually limiting delivery, and measure whether changes improve overall performance.
See how Plandek gives you system-level visibility across your SDLC
As AI increases coding throughput, this becomes even more important.
Plandek helps you understand whether that increased activity is translating into faster, more predictable, higher-quality delivery, or simply exposing new bottlenecks downstream.
Learn about Plandek’s AI-augmented engineering performance platform
Make AI adoption deliver real impact
AI is increasing coding throughput, but without visibility, it often makes bottlenecks worse.
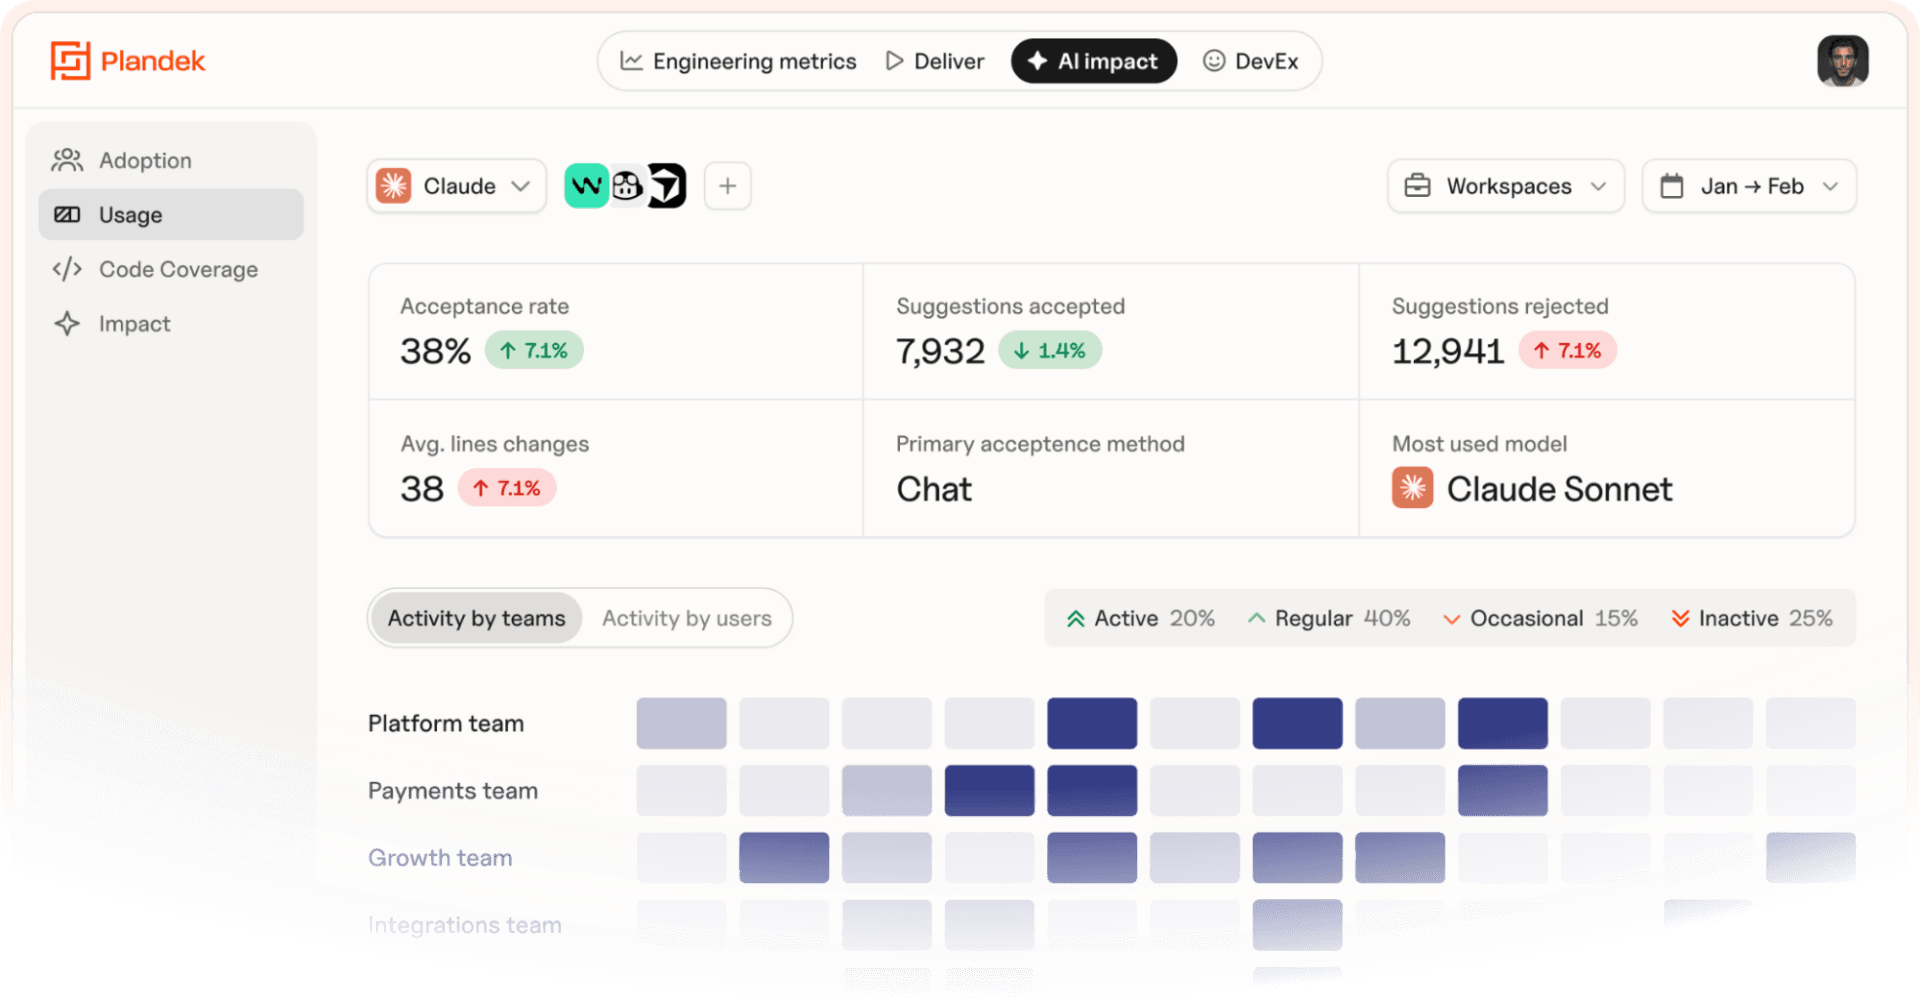
Plandek helps you understand:
Whether AI is improving delivery performance, not just activity
Where new constraints are emerging (review, testing, release)
What is limiting the impact of tools like Copilot or Claude
Plandek created the RACER framework to help engineering leaders move from tool rollout to measurable business results. Use the framework to ensure AI drives measurable gains in productivity, quality, and predictability – not just more output.
Learn about the RACER Framework and see where your delivery is actually slowing down
Plandek gives you the visibility, structure, and metrics to make that happen.
Key Takeaways
Bottlenecks are system constraints that reduce focus, speed, predictability, and quality
They show up as waiting time, not lack of activity
AI increases output, but often shifts bottlenecks downstream
More output ≠ faster delivery – the constraint still controls throughput
Bottlenecks usually sit between systems, not inside Jira
Improving delivery means continuously finding and fixing the current constraint
Written by
Charlie Ponsonby
Co-founder & CEO
Charlie started his career as an economist working on trade policy in the developing world, before moving to Accenture in London. He joined the Operating Board of Selfridges, before moving to Open Interactive TV and then Sky where he was Marketing Director until leaving to found Simplifydigital in 2007. Simplifydigital was three times in the Sunday Times Tech Track 100 and grew to become the UK’s largest TV, broadband and home phone comparison service, powering clients including Dixons-Carphone, uSwitch and Comparethemarket. It was acquired by Dixons Carphone plc in April 2016. He co-founded Plandek with Dan Lee in 2018. Charlie was educated at Cambridge University. He lives in London and is married with three children.


See how your engineering efforts translate into measurable business impact
Measure delivery performance, AI impact, and engineering productivity with hundreds of metrics, OOTB dashboards and custom configurations.


Contact us
LONDON - HQ
Unit 313 The Print Rooms, 164-180
Union St, London SE1 0LH